MICROSOFT FABRIC DATA ENGINEERING PROJECT
NYC TAXI
Context:
As part of my exploration in data engineering, I developed a project based on open data from the NYC Taxi & Limousine Commission to create an analytical report on Power BI. This project follows a structured data processing pipeline: ingestion of raw files in Parquet format, transformation and storage of data in a data warehouse, followed by modeling and visualization through a semantic model.
By leveraging Azure Data Factory for workflow orchestration and stored procedures for query optimization, I designed an interactive dashboard highlighting taxi traffic trends in New York.
Solution Architecture

Step 1: Data Collection (NYC Taxi & Limousine Commission)
This project uses TLC Trip Record Data, which tracks the trips of yellow taxis in New York City. These taxis, also known as medallion taxis, can pick up passengers across all five boroughs but are primarily found in Manhattan.
Step 2: Data Landing (Fabric Data Lakehouse)
I downloaded the available data for 2024 and loaded it into a Fabric data lakehouse.
The lakehouse will act as a storage layer to land these files.
- The yellow taxi trip data will be stored in Parquet format, with each file containing one month of data.
- Additionally, a taxi zone lookup table will be stored in CSV format, containing static reference data for taxi zones.


Step 3: Data Ingestion (Azure Data Factory – Copy Activity)
Once the data files are in the lakehouse, I’ll use a Data Factory copy activity to ingest them into a staging table in the data warehouse.
- The taxi zone lookup table will also be loaded into the staging layer as a static table, processed once and left unchanged.


- The yellow taxi trip data file path is dynamically generated using the variable
v_date, ensuring that the pipeline can process new monthly data automatically. Code: » «


Step 4: Staging Layer
- The staging layer contains the primary table
stg.nyctaxi_yellow, which stores the taxi trip data. - It also includes a static lookup table,
stg.taxi_zone_lookup yellow, which holds information about NYC taxi zones.


Step 5: Data Cleaning & Transformation (Dataflow Gen 2 & Stored Procedure)
dAt this stage, I implement data cleansing and processing before moving the data to the presentation layer.
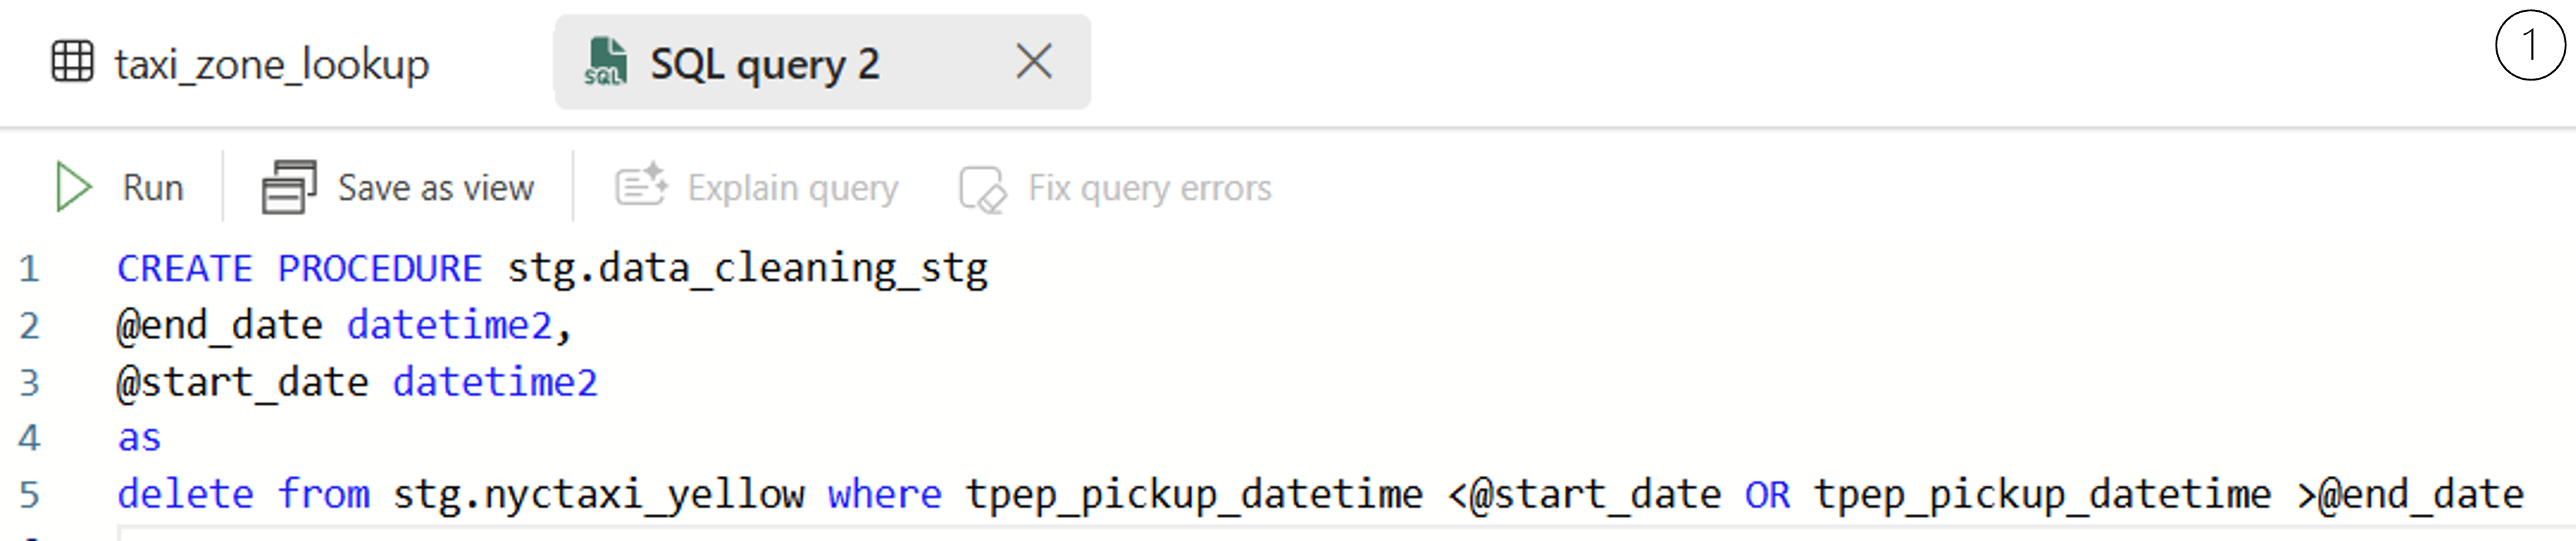
1.Create a stored procedure to dynamically delete data outside the current processing period. The stored procedure takes two parameters:
@start_date: The beginning of the processing period.@end_date: The end of the processing period.
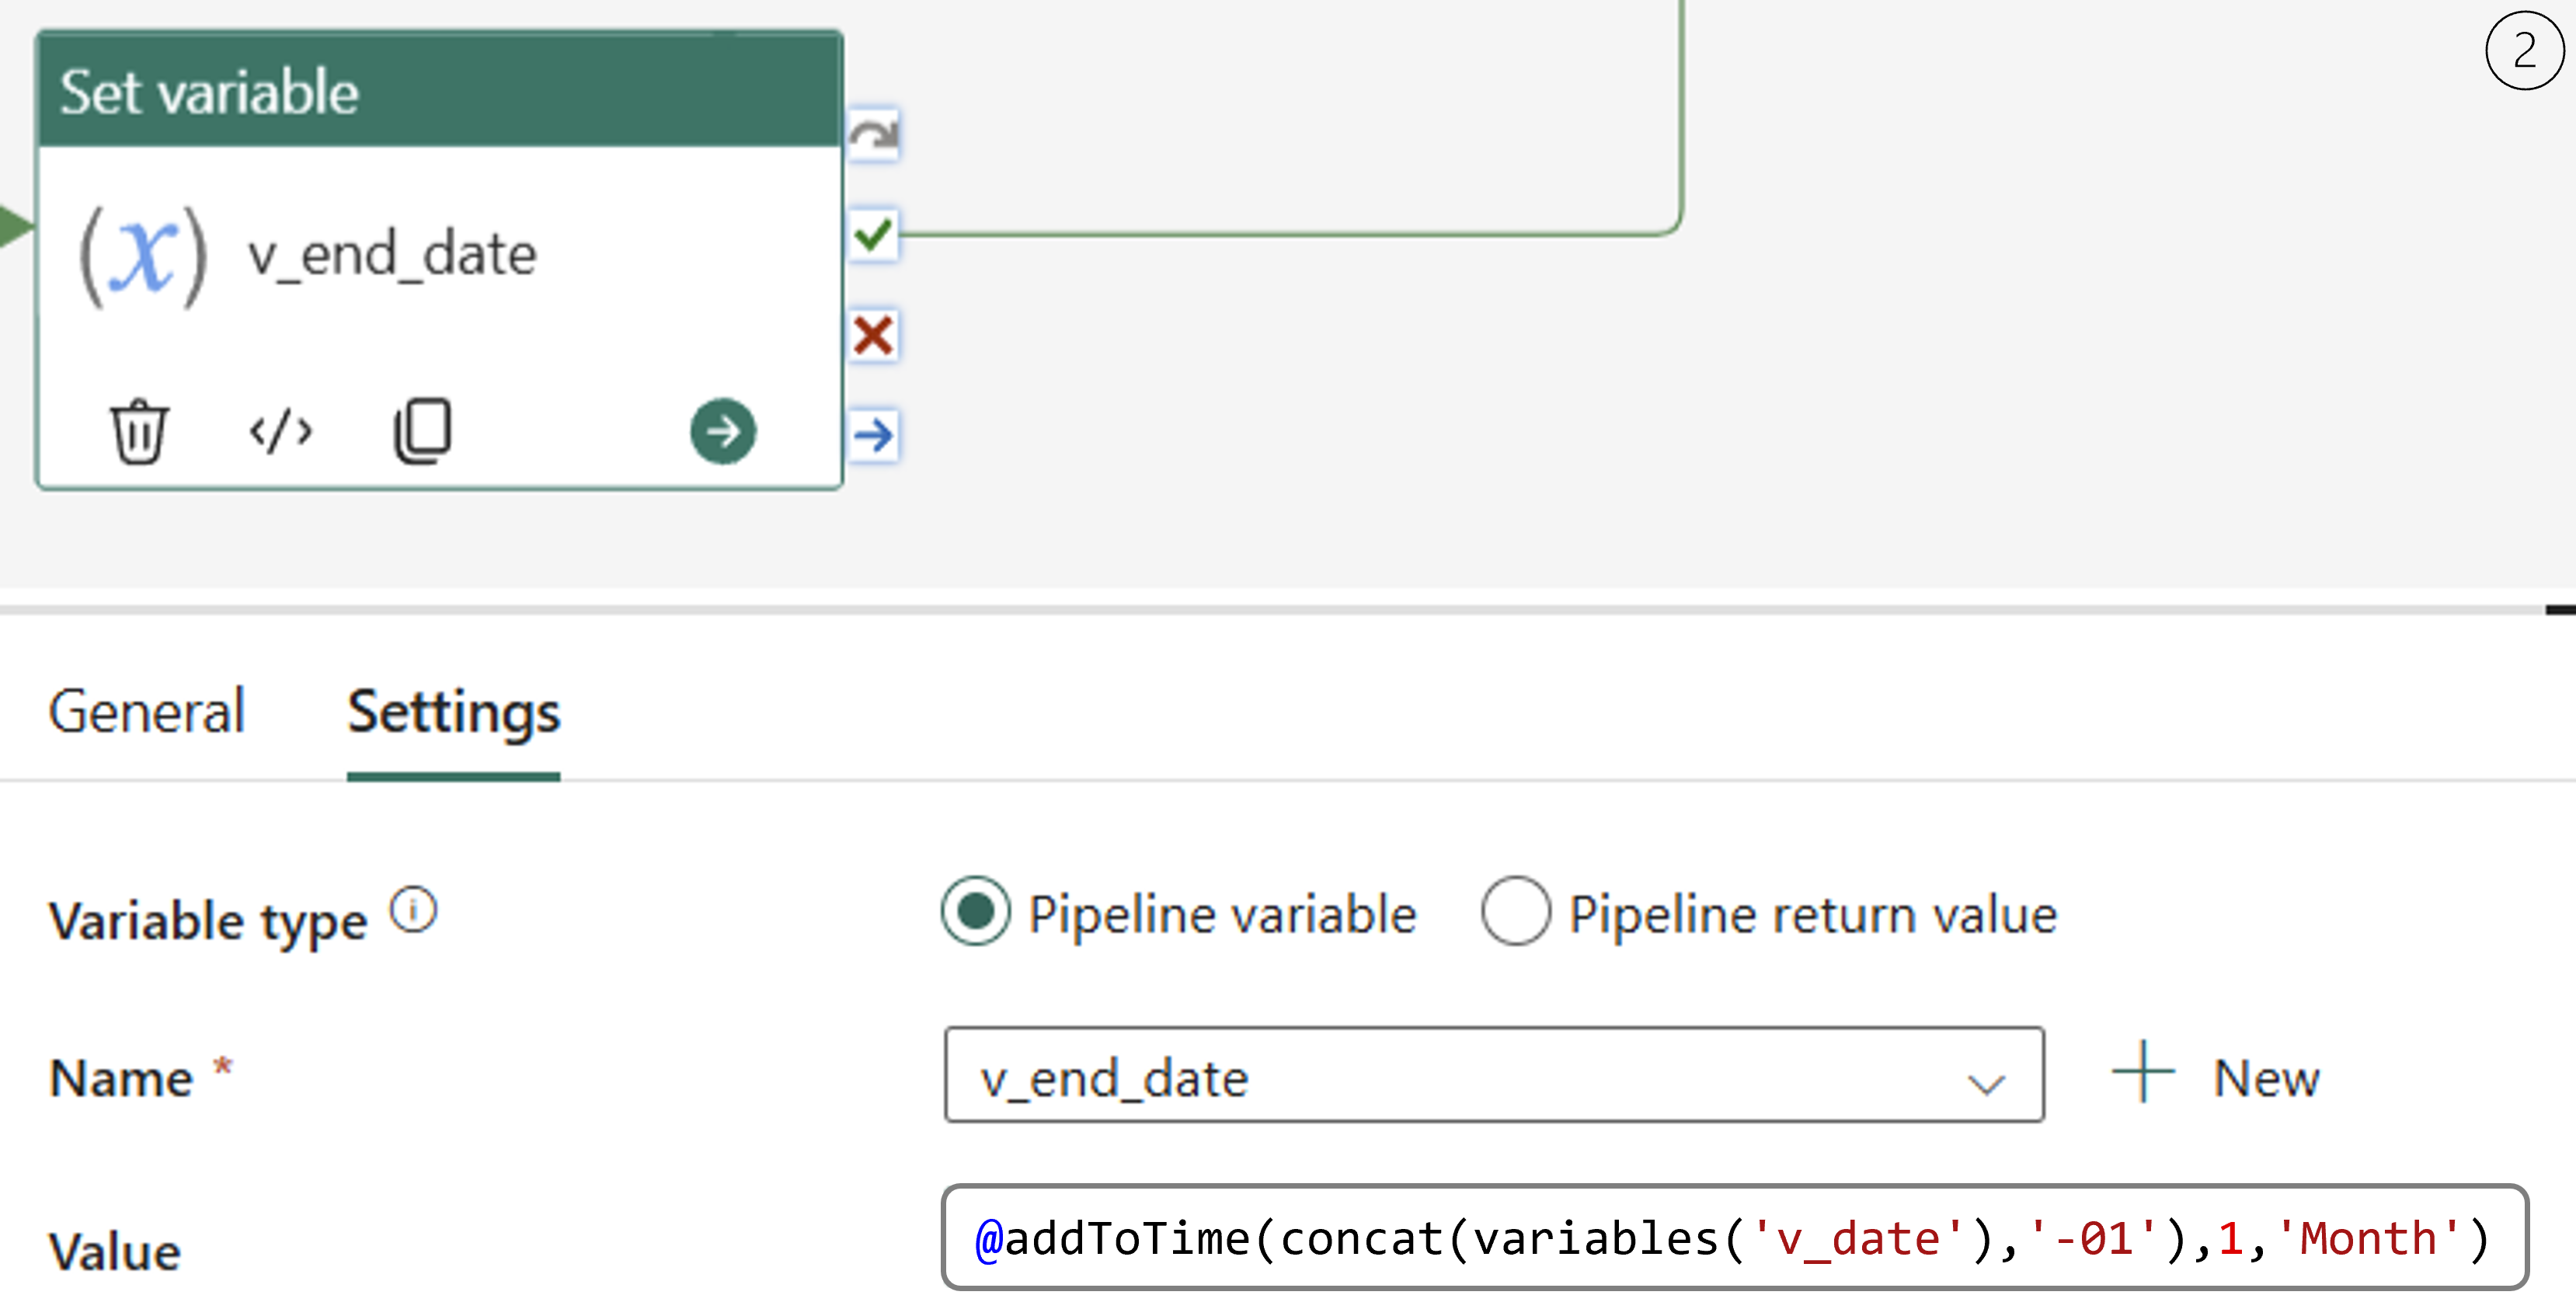
2. Define a new variable v_end_date using the « Set Variable » activity. This variable is calculated by adding one month to v_date, ensuring that the pipeline processes data within the correct time range.
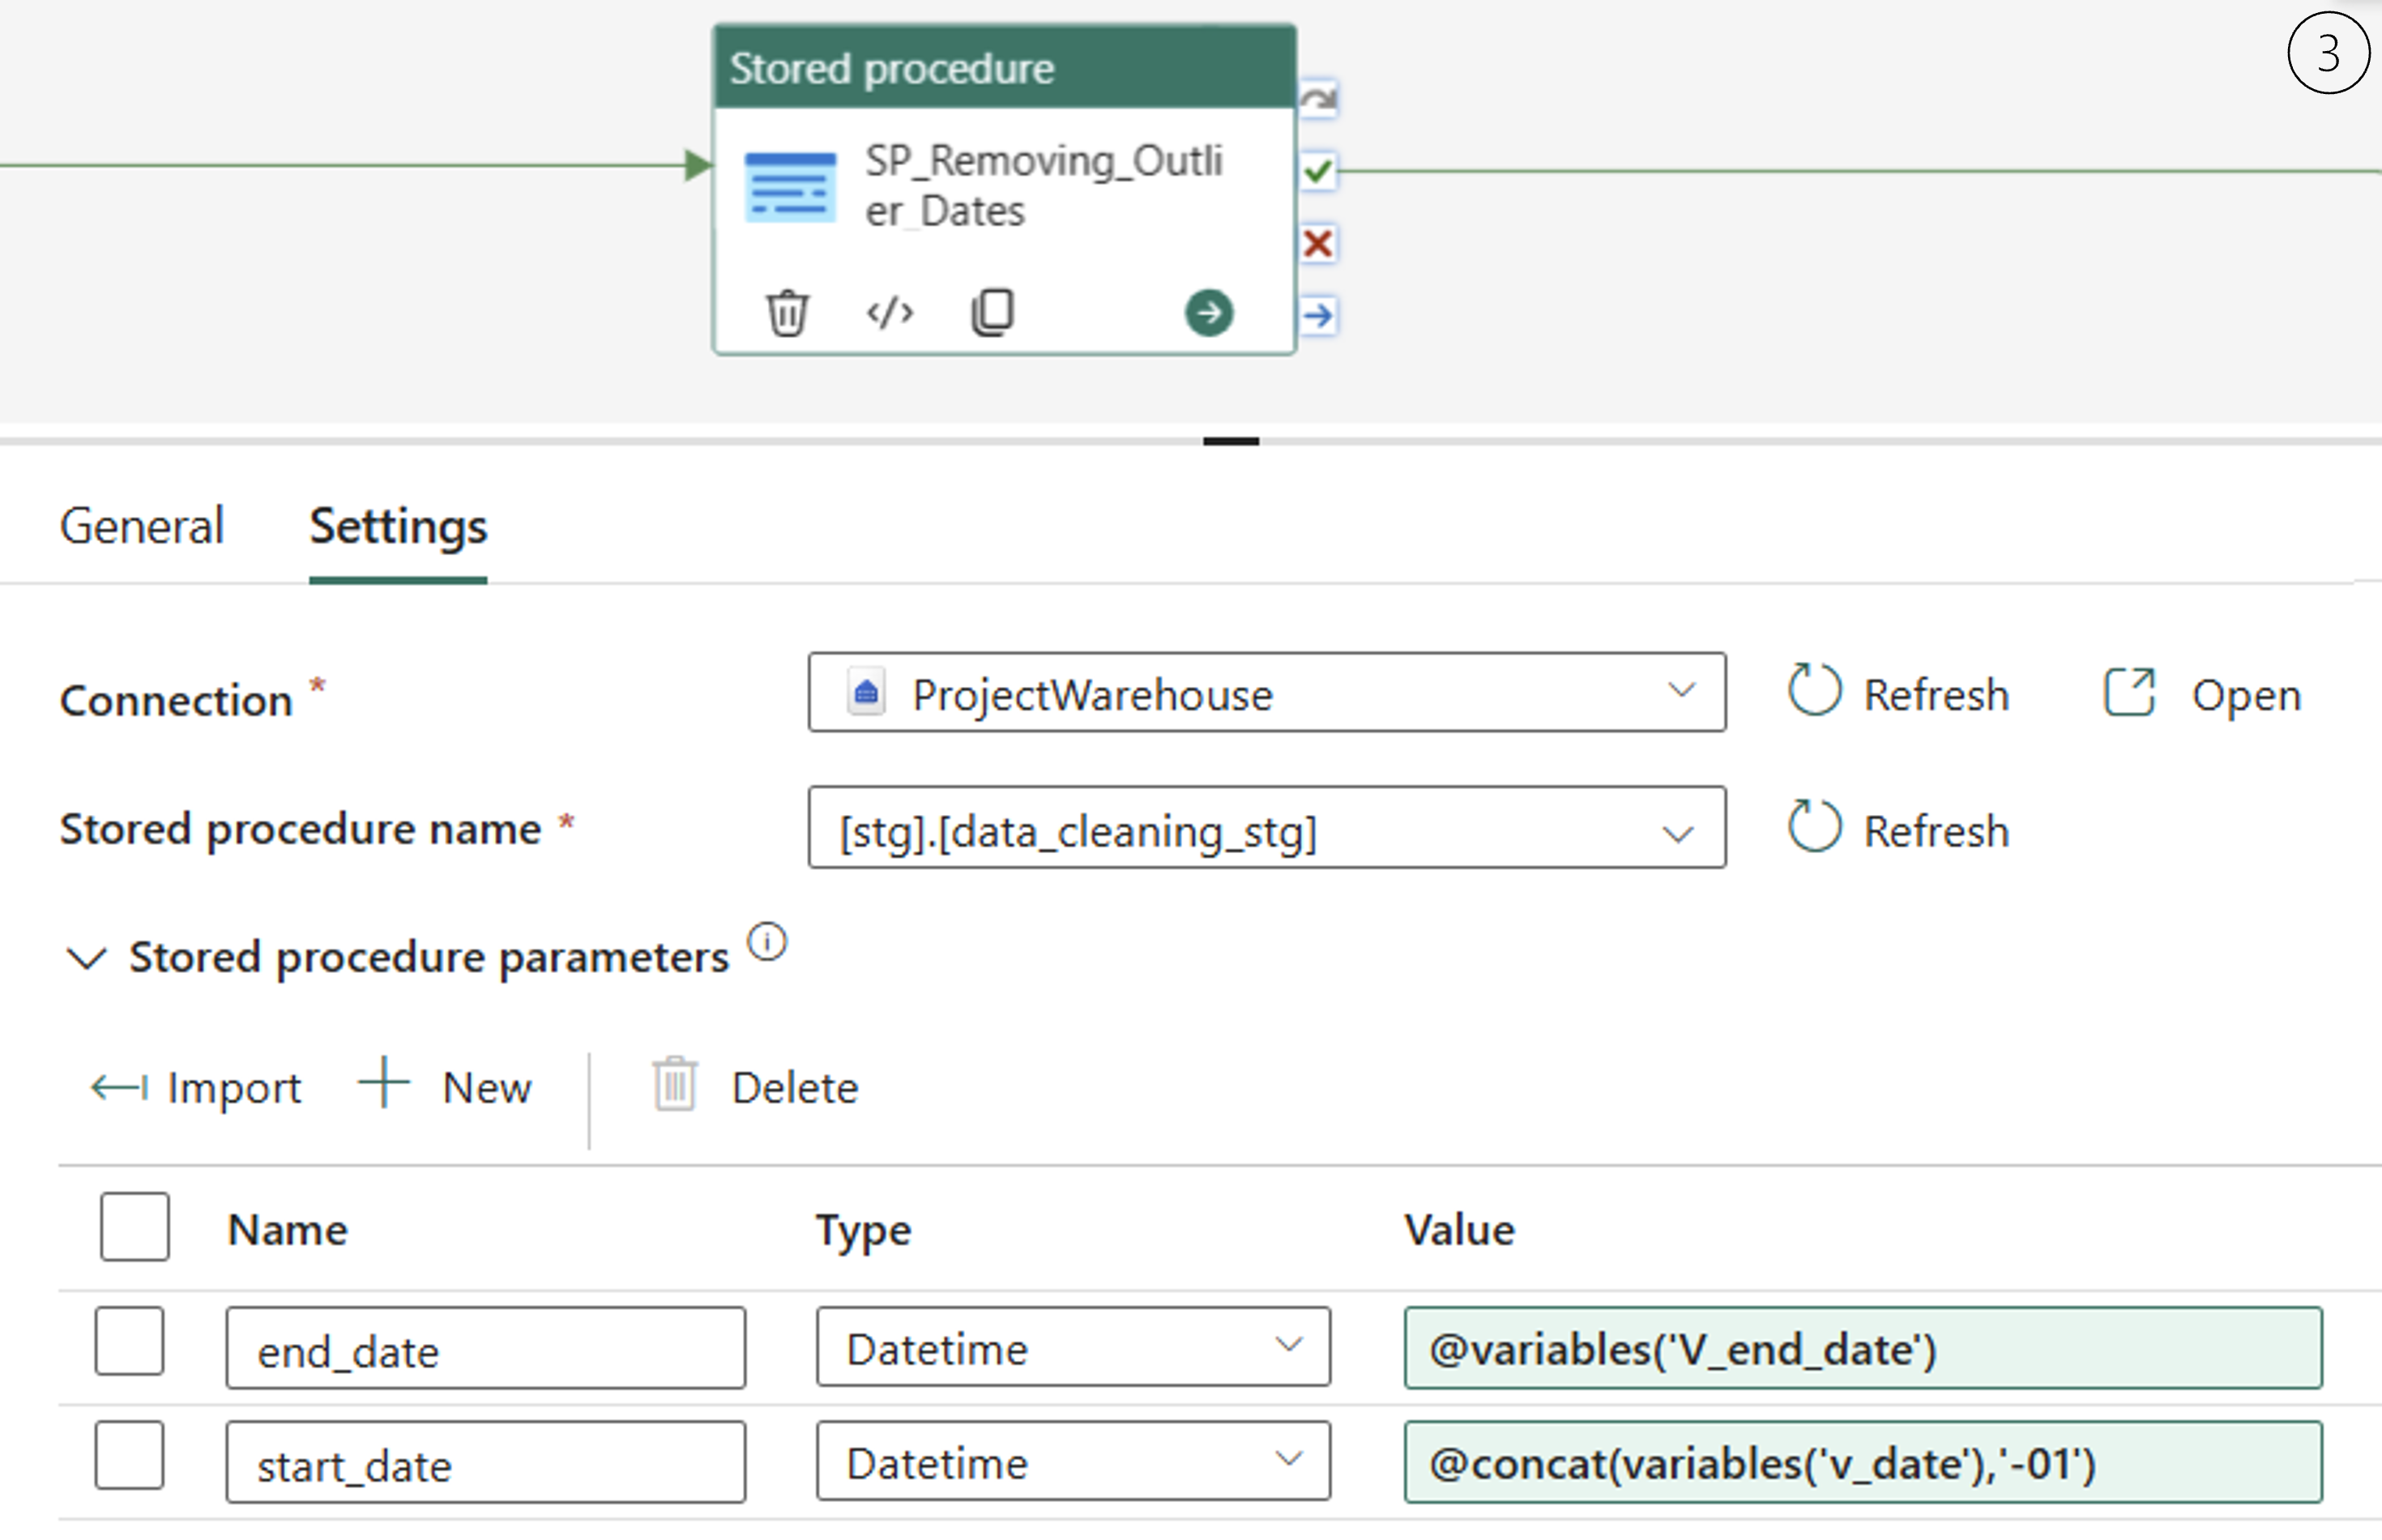
3.Use a « Stored Procedure » activity to call stg.data_cleaning_stg and pass the parameters:
- Assign
v_dateto@start_date - Assign
v_end_dateto@end_date
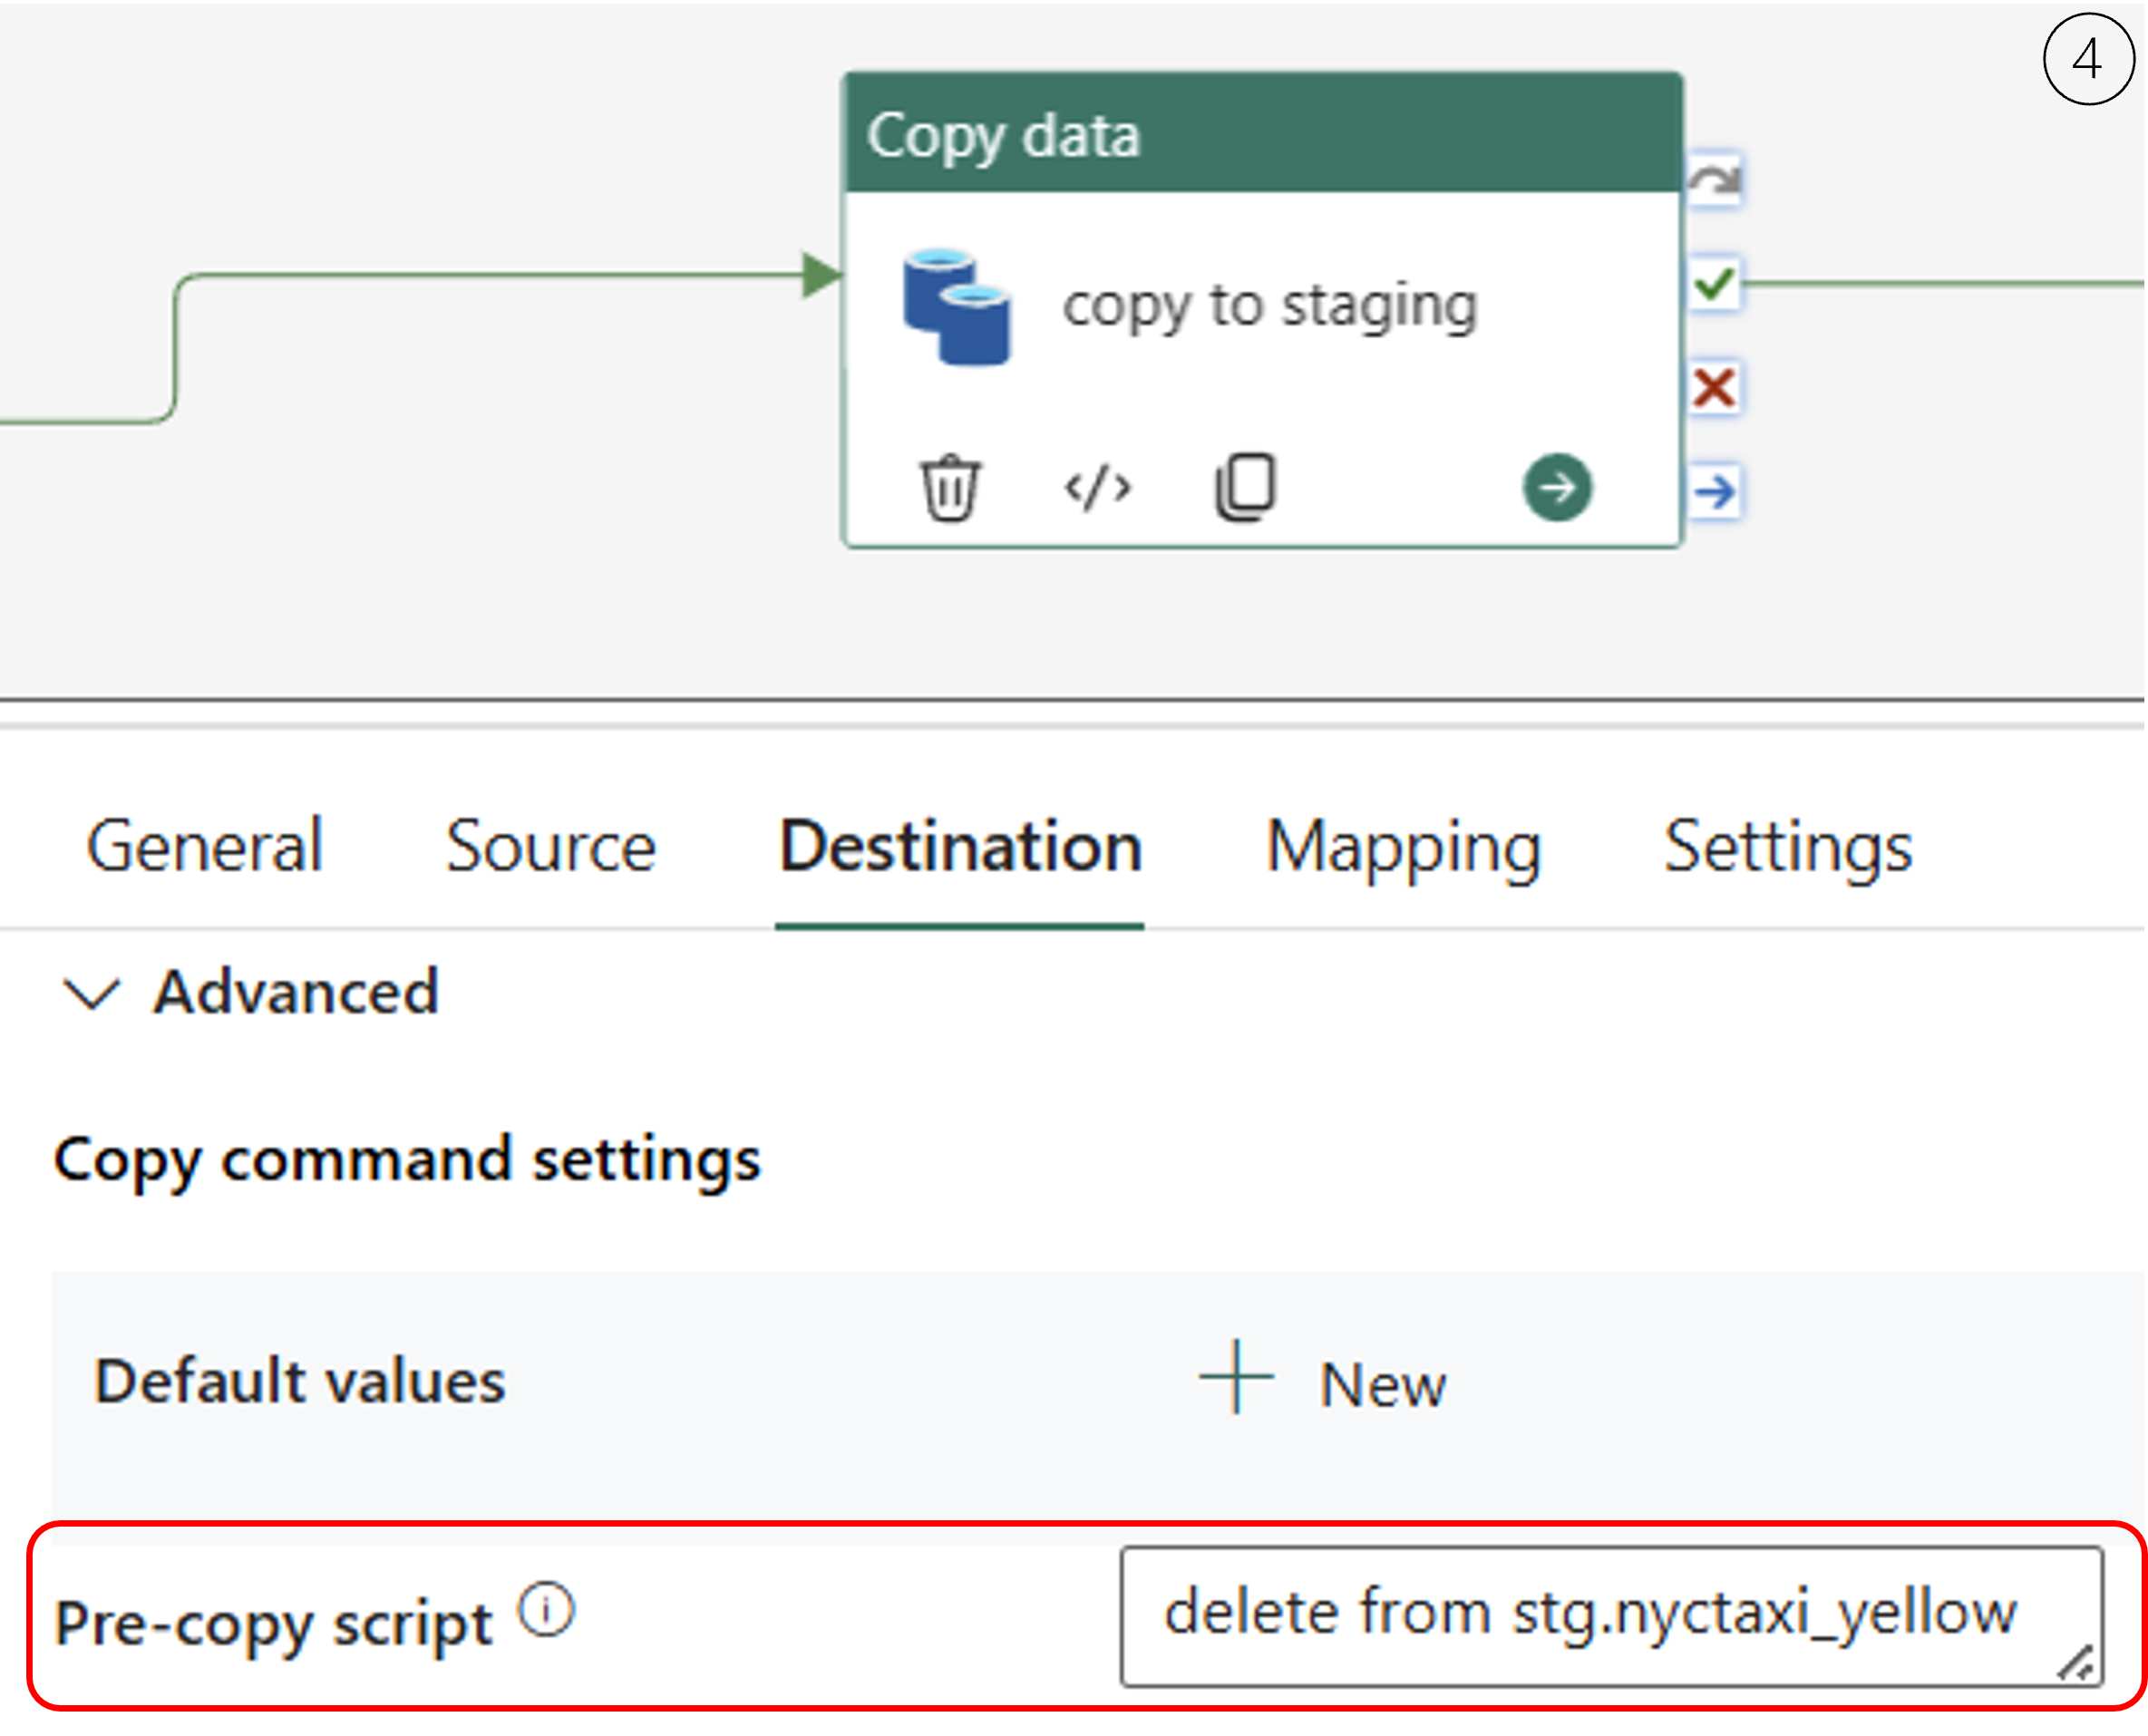
4.Ensure data consistency: In the « Copy to Staging » activity, I configured it to delete the data in stg.nyctaxi_yellow before each pipeline execution, ensuring that only the relevant data for the period is processed.
.
.
.
.
Implementing metadata logging for data processing
5. I created a metadata schema and table processing_log to track processed data, ensuring that I maintain a log of each pipeline execution.
After executing the cleaning and transformation steps, I insert a record into processing_log to track:
pipeline_run_id: Unique identifier for the pipeline execution.table_processed: Name of the processed table.rows_processed: Number of rows processed.latest_processed_pickup: The latest pickup datetime from the processed data.processed_datetime: The timestamp of the execution.
To ensure metadata is logged systematically, I wrap the insertion logic in a stored procedure that can be executed as part of the pipeline.


6. To ensure that the pipeline always processes the latest available data, I need to update the v_date variable dynamically based on the last processed data. This is done using a « Script » activity and a « Set Variable » activity.
I use a « Script activity » called Latest_Processed_Data to fetch the most recent tpep_pickup_datetime (The date and time when the meter was engaged) from metadata.processing_log. This tells us the last processed month.
Once we retrieve the latest processed pickup date, I use a « Set Variable » activity to update v_date by adding one month to it.


This pipeline « pl_stg_processing_nyctaxi » automates the ingestion, cleansing, and tracking of New York taxi data. It dynamically adjusts the processing period, stores data in staging, removes out-of-period records, and updates a metadata table to ensure traceability and efficiency.

7. This step transfers cleaned data from the staging area to the presentation layer. A Dataflow Gen2 processes and enriches the nyctaxi_yellow dataset by performing left joins with taxi_zone_lookup to add borough and zone details for both pickup and drop-off locations. Unnecessary columns are removed, values are categorized, and the final dataset is loaded into the dbo.nyctaxi_yellow table in the warehouse for analysis.


8. This pipeline « pl_processing_nyctaxi » will automate the execution of the Dataflow Gen2 and update the processing log for the presentation table. After running the dataflow, a stored procedure « insert_presentation_metadata » will log metadata, including the number of processed rows, the latest pickup timestamp, and the execution time. This ensures traceability and monitoring of the dbo.nyctaxi_yellow dataset in the warehouse.


9. To finalize the data processing workflow, a master pipeline will be created to orchestrate and invoke the staging processing pipeline (pl_stg_processing_nyctaxi) and the presentation processing pipeline (pl_processing_nyctaxi). This pipeline ensures a sequential execution where the staging process runs first, followed by the transformation and loading of data into the presentation layer. This orchestration guarantees data consistency and automation for efficient processing. warehouse.

Step 6: Presentation Layer (Data Warehouse – Ready for Reporting)
With the nyctaxi_yellow table finalized, a semantic model is created to structure and optimize the data for use in Power BI. This model ensures efficient querying, relationships, and calculated measures for analysis. Based on this semantic model, a Power BI report is developed, providing interactive visualizations and insights into NYC taxi trips, including trends, trip distributions, and financial metrics.


Step 7: Creating the Power BI Report
This Power BI report analyzes the performance of NYC yellow taxis, providing key metrics such as total revenue, number of trips, and passengers. With interactive filters and detailed visualizations, it enables exploration of trends by payment method, vendor, and pickup/drop-off locations.

Summary & Automation
This project demonstrates the capabilities of Microsoft Fabric for data engineering and business intelligence, integrating pipelines, data flows, stored procedures, scripts, and analytical modeling. The goal was to process and analyze NYC yellow taxi data, transforming raw data into actionable insights through a structured data pipeline. The data was ingested, cleaned, enriched, and stored in a presentation layer before being modeled semantically for Power BI reporting. The final dashboard provides key performance indicators, enabling detailed analysis of revenue, trip volume, and passenger distribution.
To ensure efficiency, automation was implemented at every stage. Data ingestion, transformation, and loading were orchestrated using pipelines, while metadata logging ensures traceability. The Power BI report is dynamically updated, providing real-time insights for decision-making. This end-to-end automation enhances reliability, reduces manual intervention, and ensures up-to-date analytics.